Alt text: Horizontal bar chart showing Gartner's four successive forecasts for 2026 worldwide IT spending growth: 9.8% in October 2025, 10.8% in February 2026, 13.5% in April 2026, and 14.2% in July 2026. Source: Gartner worldwide IT spending press releases.
The forecast moved four times in nine months. Gartner's outlook for 2026 worldwide IT spending growth went from 9.8% in October 2025 to 14.2% in July 2026, a US$285 billion revision to the same calendar year.
Inference has overtaken training. Of the US$42.3 billion Gartner expects to be spent on AI optimised infrastructure as a service in 2026, US$23.3 billion is inference and US$19 billion is training. Running the models now costs more than building them.
Cheaper tokens do not mean cheaper workflows. Gartner expects AI inference costs per agentic workflow to increase more than fivefold through 2028, because agentic routing consumes far more, and more expensive, tokens than a chatbot does.
Most organisations have not met this bill yet. Only 22% have scaled AI across multiple business units, and 11% of leaders did not know what their own function spent on AI in 2025.
1. Four forecasts in nine months, every one revised upward
2. Most of what you are buying is not AI software
3. The inference paradox: cheaper tokens, dearer workflows
4. Only 22% have scaled, which is why the bill still looks small
5. Australian cloud growth is in the layers you cannot see
6. Where we would start on the 2027 budget
Most Australian and New Zealand enterprises are setting their 2027 technology budgets now. A good number of them are setting those budgets against an AI cost baseline drawn from pilots that ran in 2025 and early 2026: a proof of concept in one function, a copilot licence for a team, a retrieval assistant sitting on a document store. Those numbers were real. They are also the cheapest AI will be per unit of work your organisation actually does, and the gap between pilot economics and production economics is now large enough to be a planning problem rather than a rounding error.
We have found this pattern before in cloud, and the lesson transfers. The cost of a technology at pilot scale tells you almost nothing about its cost at production scale, because the variable that drives the bill changes. In cloud it was data egress and always on environments. In AI it is the number of model calls a finished workflow makes, which is a function of how good you have made the workflow, not how cheap the underlying tokens have become.
The clearest evidence that the ground is moving is that the people who forecast this market for a living keep having to correct themselves, in the same direction, about the same year. In October 2025 Gartner put 2026 worldwide IT spending at US$6.08 trillion, 9.8% growth. By February 2026 that was US$6.15 trillion and 10.8%. By April, US$6.31 trillion and 13.5%. By July, US$6.37 trillion and 14.2%. Four published forecasts for one calendar year, each higher than the last.
What matters for a budget holder is not the headline but where the revision landed. Growth is not spread evenly across the technology estate.

Alt text: Horizontal bar chart of forecast growth in worldwide IT spending by segment for 2026: data centre systems 62.5%, infrastructure as a service 29.3%, software 15.5%, devices 9.8%, IT services 5.3%, communications services 4.4%. Source: Gartner, 27 July 2026.
Data centre systems are forecast to grow 62.5% in 2026, to US$822 billion. Infrastructure as a service grows 29.3%. Meanwhile IT services grow 5.3% and communications services 4.4%. John David Lovelock, Distinguished VP Analyst at Gartner, described the underlying build as "the largest infrastructure project ever attempted" and, separately, noted that "technology budgets are being strained by inflation, supply shortages, rising hardware and memory costs, AI funding initiatives and shifting priorities."
That last point is not abstract. TrendForce expected server DRAM contract prices to rise 13 to 18% quarter on quarter in the third quarter of 2026, with RDIMM bit supply growing only 15 to 20% year on year against faster server CPU shipment growth. Component scarcity in the supply chain eventually arrives on your invoice, whether you buy the hardware or rent it.

Alt text: Horizontal bar chart of forecast worldwide AI spending by segment in 2026, in billions of US dollars: AI infrastructure 1,432, AI services 586, AI software 453, AI cybersecurity 51, AI models 33, AI platforms for data science and machine learning 30. Source: Gartner, 19 May 2026.
AI infrastructure accounts for roughly US$1.43 trillion of that, more than half. AI software, the layer most executives picture when they approve an AI budget, is US$453 billion. Lovelock's framing is that AI infrastructure will account for "over 45% of spending" over the next several years, driven predominantly by vendors, and that "2026 will be the inflection year" for enterprise AI investment.
The practical reading for a CTO is that the AI market is currently an infrastructure market wearing an application market's marketing. You are not buying features at these prices. You are buying compute, and compute is metered.
Here is where the planning error usually sits. Everyone has watched per token prices fall and reasonably concluded that AI gets cheaper over time. Gartner's August 2026 research is a direct challenge to that inference.
Will Sommer, Sr Director Analyst, Gartner
Gartner's prediction is that AI inference costs per agentic workflow will increase more than fivefold through 2028, and that agentic reasoning model routing raises provider inference costs by at least five times compared with a basic chatbot interaction. The firm calls it the Inference Paradox: model efficiency improves, which makes it viable to deploy more capable and more expensive models, which are then used in workflows that consume far more tokens than the simple interactions they replaced. Unit price falls; units consumed rise faster.
WHAT IS FALLING
WHAT IS RISING
Cost per token for a given level of model capability
Tokens consumed per completed piece of work
Cost of training and fine tuning as a share of AI optimised IaaS spend: US$19bn of US$42.3bn in 2026
Inference as a share of the same: US$23.3bn in 2026, and the larger half for the first time
The barrier to deploying a more capable model
The number of model calls a mature agentic workflow makes per task
Effort required to build a working prototype
Cost of running that prototype across an enterprise
This is why the shape of the bill changes as a pilot succeeds. A proof of concept is a capitalish event with a known end date. A production agentic workflow is an operating cost that scales with usage, and improves its own quality by spending more.
The reason this has not yet shown up on most balance sheets is that most organisations have not got there. A Gartner survey of 1,303 enterprise leaders at organisations with at least US$50 million in FY2025 revenue, fielded between January and April 2026, found that 22% had successfully scaled AI across multiple business units or adopted an AI first approach. Eighty five per cent of functional leaders planned to increase spending in 2026, from an average of 12% of functional budgets in 2025.
Every figure in this article is a vendor neutral analyst forecast, not an outcome. Forecasts of this market have been revised upward four times in nine months, which should make you treat the precise numbers as directional rather than exact, in either direction. Note also that Gartner reports infrastructure as a service as its own line alongside the five headline IT segments, so the growth rates in the second chart are not a clean partition of one total.
Two findings from the same survey deserve more attention than the headline. The first is that 11% of functional leaders were entirely unaware of what their own function spent on AI in 2025. The second is the performance spread: high performers reported positive returns on 81% of AI initiatives, while low performers simply did not know the return on 29% of theirs. Tina Nunno, Distinguished Vice President and Gartner Fellow, put the conclusion plainly: "Without disciplined measurement tied directly to business outcomes, organizations risk wasted resources and unmet expectations."
An organisation that cannot see what it spends today has no mechanism to notice a fivefold change in unit cost. That is the governance problem underneath the cost problem.
The Australian data tells the same story in local currency. Gartner forecasts Australian organisations will spend more than A$33.6 billion on public cloud services in 2026, up 17.9% on 2025.

Alt text: Horizontal bar chart of forecast growth in Australian public cloud spending by segment for 2026: infrastructure as a service 24.1% at A$7.09bn, platform as a service 20.9% at A$10.00bn, software as a service 13.8% at A$16.38bn, desktop as a service 9.7% at A$0.16bn. Source: Gartner, 11 May 2026.
Software as a service is still the largest segment at A$16.4 billion, but it is growing at 13.8%. Infrastructure as a service grows at 24.1% and platform as a service at 20.9%. The layers growing fastest are the ones a finance team cannot easily attribute to a business outcome, because they do not arrive as a named product with a per seat price.
New Zealand organisations should not read the Australian figures as irrelevant. Most NZ subsidiaries and suppliers of Australian groups buy their cloud and AI capacity through the same regional contracts and the same hyperscaler price lists, so the cost curve is inherited even where the regulatory and reporting environment differs. The exposure arrives contractually rather than by local market dynamics.
Adrian Wong, Director Analyst at Gartner, offers the counterweight, and it is worth taking seriously: "There's a shift toward inference optimized approaches as organizations fine tune smaller domain specific models instead of relying on larger general purpose LLMs," with many "turning to hybrid cloud architectures to push this processing to the edge, which lowers cloud costs while still supporting automation at scale." That is a real lever. It is also a design decision that has to be made deliberately, early, and by someone who owns the cost line.
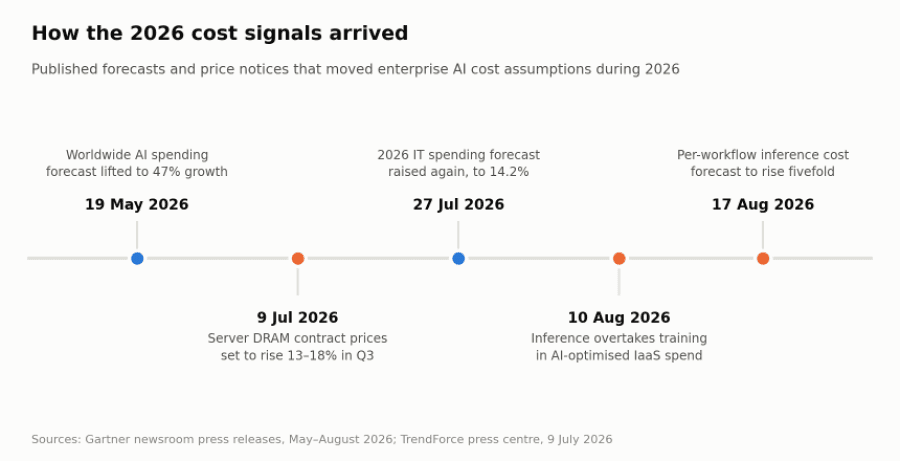
Alt text: Timeline showing 2026 cost signals: 19 May worldwide AI spending forecast lifted to 47% growth; 9 July server DRAM contract prices set to rise 13 to 18% in Q3; 27 July 2026 IT spending forecast raised to 14.2%; 10 August inference overtakes training in AI optimised IaaS spend; 17 August per workflow inference cost forecast to rise fivefold. Sources: Gartner newsroom, TrendForce.
None of this argues for spending less on AI. It argues for knowing the unit you are buying. Three things, in order, before the 2027 numbers are locked.
WEEKS
FOCUS
WHAT "DONE" LOOKS LIKE
1 to 4
Measure the unit
Cost per completed workflow (not per seat, per token or per month) for every AI workload already in production, with an owner named against each
5 to 8
Tier the models
A routing policy that sends each task to the cheapest model that can complete it, with the expensive reasoning path reserved for tasks that demonstrably need it
9 to 12
Budget for the curve
A 2027 forecast built on the cost of the workflow at target volume, with an explicit trigger for review if unit cost moves beyond an agreed band
The first is the one most organisations skip, and it is the one that makes the other two possible. Gartner's own recommendation to product leaders is to maintain multimodel ecosystems and implement optimised inference tiering, routing and orchestration, which is another way of saying that "which model runs this step" should be an architectural decision with a price attached, not a default.
The second deserves a note of realism. Model routing adds a component that has to be built, monitored and kept current as models change underneath it, and that work is not free either. In our experience the honest version of this business case compares the routing effort against the projected inference bill at target volume, rather than assuming the routing pays for itself.
The third is simply budget hygiene. If the analyst community revised the same calendar year four times in nine months, a fixed annual figure with no review trigger is not a forecast; it is a hope.
This article draws on publicly available information from the sources listed in the fact check list. Digital400 accepts no liability for the accuracy or completeness of that information, or for any decision taken in reliance on it. It is general commentary, not professional advice.
No. Gartner's prediction is about the inference cost per agentic workflow through 2028, not about any organisation's total AI spend. Your total bill depends on how many workflows you run, at what volume, and how aggressively you route work to cheaper models. The figure is a warning about unit economics, not a forecast of your invoice.
That falling price is exactly what drives the effect. Cheaper and more efficient models make it viable to deploy more capable ones, and those get used in workflows that make many more model calls than the simple interactions they replaced. The unit price and the units consumed move in opposite directions, and Gartner's view is that consumption wins.
No, and it would be a poor one. The research describes what capable agentic workflows cost, not whether they are worth it. The argument is for pricing them properly before committing to a volume, and for not assuming that a favourable pilot cost will hold once the workflow is genuinely good.
Gartner's Australian cloud analysis says the shift towards inference optimised approaches with smaller domain specific models is lowering cloud costs while still supporting automation at scale. The caution is that this is a design choice with engineering effort behind it: model routing and orchestration have to be built and maintained, so the saving is real but not automatic.
Because you are renting capacity out of that build. A 62.5% forecast increase in data centre systems spending, alongside server memory contract prices rising 13 to 18% in a single quarter, describes cost pressure in the supply chain that sits underneath every hyperscaler price list. It does not pass through immediately or evenly, but it does not vanish either.
Not directly: the A$33.6 billion figure is a forecast of Australian organisations' spending. It is relevant because most New Zealand subsidiaries and suppliers within Australian corporate groups buy through the same regional agreements and the same global price lists, so they inherit the cost curve contractually even though the local market is a different size.

Maheen Abeysooriya
Software Engineer Intern
Blog